Wikisage, the free encyclopedia of the second generation, is digital heritage
Template:NSW TrainLink Intercity patronage by line: Difference between revisions
Jump to navigation
Jump to search
(update for 2018-19) |
(update style and add graph image) |
||
| Line 1: | Line 1: | ||
<div class="toccolours" style="display: inline-block; <!--{{if affirmed|{{{float}}}|float:left;margin-right:10px}}-->"> | |||
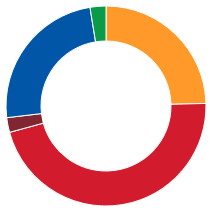
<div style="font-weight:bold;line-height:1.6;text-align:center;">2018-19 NSW TrainLink Intercity patronage by line<ref group=n.b.>Figures based on Opal tap on and tap off data.</ref> | |||
<ref>{{cite web|title=Train Patronage - Monthly Figures|url=https://www.transport.nsw.gov.au/data-and-research/passenger-travel/train-patronage/train-patronage-monthly-figures|publisher=Transport for NSW|accessdate=23 August 2019}}</ref></div> | |||
{| class=" | <div style="display:flex; flex-wrap:wrap; flex-direction:row;"> | ||
<div> | |||
|- | {| class="sortable" style="text-align:right;" | ||
!Line !!Figure | |||
| | |-{{#switch:{{{BM}}}|y={{TH}} }} | ||
|{{NSWPTL|BMT}} | |||
|{{formatnum:10154000}} | |||
|-{{#switch:{{{CCN}}}|y={{TH}} }} | |-{{#switch:{{{CCN}}}|y={{TH}} }} | ||
|{{NSWPTL|CCN}} | |{{NSWPTL|CCN}} | ||
| Line 24: | Line 23: | ||
|{{formatnum:1062000}} | |{{formatnum:1062000}} | ||
|} | |} | ||
</div> | |||
<div style="align-self:center;"> | |||
[[File:NSW TrainLink patronage by line last financial year.png]] | |||
<!--{{Graph:Chart|width=100|height=100|type=pie|innerRadius=65|colors=#ff9929, #d31b2e, #802630, #0156a8, #099b48 | |||
|x=Blue Mountains, Central Coast & Newcastle, Hunter, South Coast, Southern Highlands | |||
|y=10154000, 19062000, 984000, 10033000, 1059000 | |||
}}--> | |||
</div> | |||
</div> | |||
</div> | |||
<noinclude> | <noinclude> | ||
Make sure to add <code><nowiki>{{reflist|group=n.b.}}</nowiki></code> to the transcluding articles (use ''what links here'') in order to show the notes.{{reflist|group=n.b.}} | |||
[[Category:NSW TrainLink templates]] | [[Category:NSW TrainLink templates]] | ||
[[Category:New South Wales transport patronage templates]] | [[Category:New South Wales transport patronage templates]] | ||
</noinclude> | </noinclude> | ||
Latest revision as of 08:19, 23 August 2019
| Line | Figure |
|---|---|
| 10,154,000 | |
| 19,062,000 | |
| 984,000 | |
| 10,033,000 | |
| 1,062,000 |
Make sure to add {{reflist|group=n.b.}} to the transcluding articles (use what links here) in order to show the notes.
- ↑ Figures based on Opal tap on and tap off data.
- ↑ "Train Patronage - Monthly Figures". Transport for NSW. https://www.transport.nsw.gov.au/data-and-research/passenger-travel/train-patronage/train-patronage-monthly-figures. Retrieved 23 August 2019.
